Background
Offsite Management Systems specializes in consulting related to fuel blending and automation of refinery offsite operations. We are surveying US and Canadian refineries on the performance of their fuel blending operations to establish performance benchmarks and best practices in this area.
The survey evaluates fuel (Gasoline, Diesel, kero and Fuel oils) blending operations in each refinery by the following two indices:
- Automation Effectiveness
- Operational Efficiency
Automation Effectiveness
It reflects the sophistication of blending system installed at the refinery as well as the usage of the system by refinery staff. The calculation of automation effectiveness includes information on:
- Tank farm automation (signals, stock tank allocations, line-up)
- Field Equipment (Pumps, control valves, MOV’s)
- Timely availability of component property information
- Types of analyzers, their locations and sampling methods
- Computer Hardware (DCS, APC)
- Regulatory and Advanced Control Strategy
- Reconciliation of plan versus executed blends
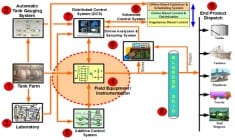
Figure 1 Modules evaluated for Automation Effectiveness Index
Operational Efficiency
It measures how well blending operations are performed on a day-to-day basis. The calculation of operational efficiency takes into account both properties give-away in the final blend (if any) and formulation of optimum recipes by using least expensive components available in the stocks pool.
- Evaluates actual blend execution data against best case and worst case
- Measures profit improvement potential in $$ / year and separates benefits by
-Stock economics
-Giveaway minimization
-Inventory minimization
- Ranks against other refineries using ratio of profit captured / profit available
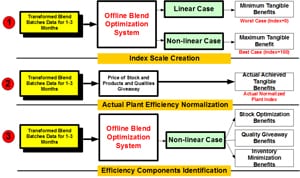
Figure 2 Process to estimate the Operational Efficiency Index
Benefits
- A detailed, independent assessment of blending operations at your refinery
- Benchmark against the rest of the industry
– How automated are blending operations?
– How well are blending operations executed?
- Identifies specific improvement projects with benefits for each project
– Sound basis for project appropriation
- Measure improvement over time
– Project post audit
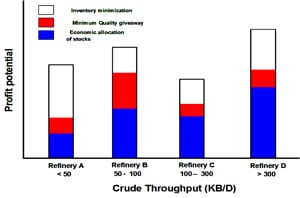
Figure 3 Examples of Identified Project Benefits
Required Data
- Supply information about the configuration of the plant blending equipment and operations, a detailed fill-in list of questionnaires will be supplied.
- Supply 6 to 12 months of blending operational data for actually executed blends. OMS will furnish a formatted excel worksheet to input all required data. Alternatively, a dump of information from your plant database can also be used.
Methodology
- We will issue detailed questionnaires to assess the level of blending automation from all points of view and assign detailed weighting factors and status level to each and every category of automation to generate an automation effective index for your refinery. In our experience, this is accurate with ± 5% for all practical purpose.
- OMS will use our own optimization software to re-evaluate and optimize each and every blend batch data to evaluate how effective your blending was and to estimate the lost tangible benefits from recipe and inventory optimization to minimize quality giveaways.
- We use all latest nonlinear blend models and non-linear optimizer algorithm to capture maximum benefits. Lowest benefits are calculated using linear blending models and simply linear programming.
- Above methodology will generate two indexes for your refinery as shown below and will be compared with other refineries on the same basis.
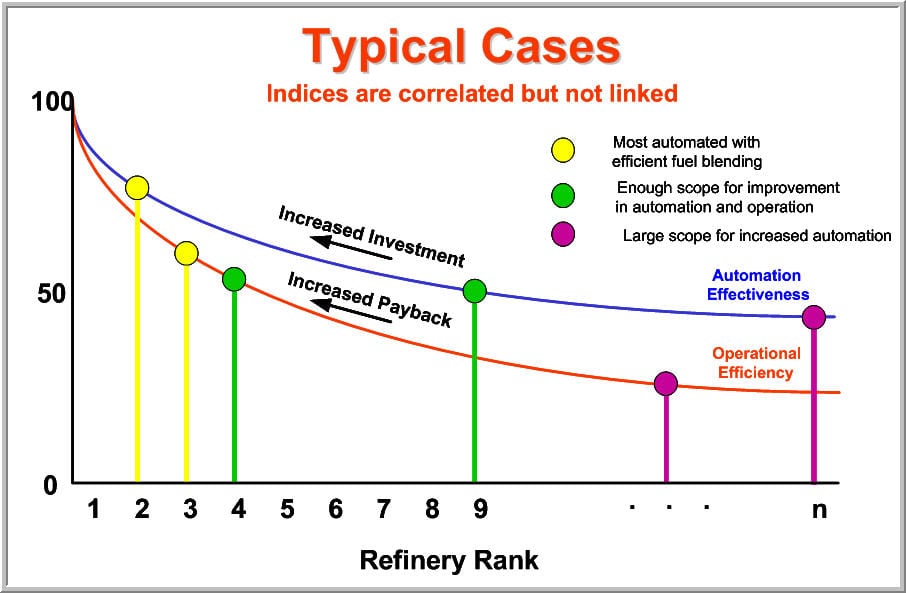
Figure 4 Relative Refinery Rankings
Deliverables
- A report on the overall findings of the survey
- Operational efficiency and automation effectiveness indices for your refinery
- Comparison of your operational efficiency and automation effectiveness to the aggregated results of the refineries in the study
- A presentation by an OMS expert on the results of the survey
Schedule and Cost
- Month-1 Kick-off and Data Collection and consolidation
- Month-2 Data Analysis and generation of Efficiency indices
- Month-3 Compilation of final survey Report and presentation of results
- Month-4 Follow-up and close-out
Please contact us for quotation to participate on individual refinery basis or for corporate-wide refineries.
Confidentiality
Contact Information
If you would like to participate in the survey or partner with us, please contact us.
Offsite Management Systems LLC
2003 Baker Estates Dr. Houston, Texas 77094, USA
Tel: +1-832-821-8001 Fax: 866-450-4035
Email: info@globaloms.com Web: www.globaloms.com
Copyright 1998-2015 Offsite Management Systems LLC. All rights reserved. OMS™, OMS logo (Tri-circle Triangle), ”…Redefining Excellence, gomsTQTS™ are trademarks of Offsite Management Systems LLC, USA.